by Felicien | May 25, 2017 | Education
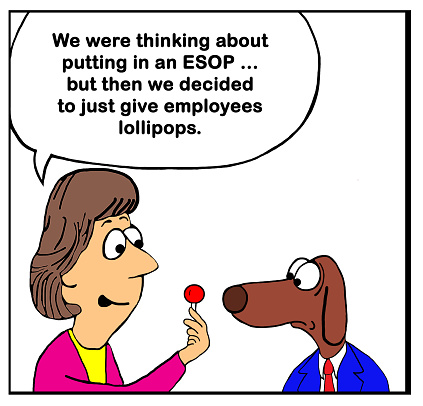
ESOPs aren’t just a way to encourage employees to invest – they can also prove very useful for long-term business goals.
News recently came in that a new Colorado bill was just signed into law to make it a lot easier for small business owners to start up ESOPs, or employee stock ownership plans, thanks to a new focus on talking about ESOPs with owners and more funds available to start an ESOP via a small loan.
Now, when people start talking about ESOPs a lot of the focus is traditionally on the benefits for employees – how they can save on taxes, get rewarded by the company, and so on. But we wanted to take some time to talk about why ESOPs are useful for growing companies, and why they are becoming increasingly popular ways of meeting very specific goals that business owners may have in mind. Here’s a more detailed look.
Slow Value Building in Preparation for Bigger Things
Traditional entrepreneurship uses funding rounds to both raise additional funds for expansion and help increase the expected market value of the company. However, there are far fewer options further down the ladder, if you aren’t nearly ready for a funding round or going public, but still want to help increase the value of the company in a much safer, more stable way. An ESOP does exactly this: By allowing employees to slowly and comfortably invest back in the company, the ESOP can help increase value in more controlled ways than a funding round.
Of course, that comes with consequences too: an ESOP can complicate any plans to go public, and it tends to work best with successful companies rather than those struggling. But for smaller businesses that have been looking for their own value-building solution, it remains an ideal choice.
Borrowing Options
Thanks to the increased interest in ESOPs, it’s now a lot easier to borrow money to help start them. The new CO rule, for example, allows the state to loan business owners up to $10,000 for the process, and if state agencies are more willing to lend, you know that average banks and credit unions are also going to be more lenient. This is great news because one thing keeping smaller companies from creating ESOPs was a lack of funds. It can be surprisingly expensive to switch to an ESOP model for your business, especially if that requires updating financial practices and meeting a bunch of new requirements. Money available for the initial costs is an increasingly common advantage (of course, you still shouldn’t take out a loan you can’t afford).
Retirement Plans
“Well, of course, an ESOP is a retirement plan,” you may be thinking. But that’s not really what we mean. You see, the goal of many ESOPs is to gradually move ownership from the company founder to the employees. In other words, it can be a valuable exit strategy for business owners that want to gradually back from personal responsibilities and eventually leave the business entirely – without the stress of making a sale or arrangement a more immediate replacement option.
Ideal for Growth Industries
In Colorado, the new ESOP law is particular encouraging for small companies in growth industries – which in CO would be craft beer and cannabis, of course. ESOPs, in general, are a good deal for young businesses that are riding a wave of growth and want to expand – but aren’t ready to go public for another decade or two. If you are part of a growth industry and are looking for ways to maintain growth and tap into the excitement surrounding your business, then consider creating an ESOP model during your expansion efforts.
General Buy-In and Productivity
“Retention” is a word that gets frequently mentioned when talking about ESOPs. Yes, employees are more likely to stay around if they have a real investment in the company. But in a broader sense, an ESOP is perfect for employee buy-in and productivity, even if the employee chooses to not invest directly. The fact that the company cares enough to allow employees “first dibs” and a chance to profit from company efforts is a winning combination for a successful business. It tends to increase positivity, fuel greater productivity, and attract new interest from talented individuals.

by Felicien | May 25, 2017 | Education
Devices as a Service? It makes more sense than you might think: Here’s why.
The “as-a-Service” trend is nowhere near dying out yet: Companies are determined to try everything as a service until they find out what ultimately works and what doesn’t. That can lead to a little uncertainty when adopting new services because no company wants to be caught in a temporary fad, especially when making big systems decisions.
But we want to talk about a particular Service trend, DaaS, or Devices as a Service. No, that doesn’t mean moving all your devices onto the web – it means leasing company mobile devices from a particular IT vendor for monthly fees instead of using BYOD or a company purchasing plan. It may sound odd, but here’s why more businesses are buying into the practice.
It’s More Familiar Than You Might Think
DaaS isn’t exactly new. In fact, companies have been using it for decades with very familiar devices like copy machines. For many smaller companies that once relied greatly on copiers, it wasn’t really feasible to invest in their own model, so copier manufacturers and vendors began to offer leasing opportunities to smaller companies. It worked out perfect for smaller businesses because the leases typically included room for repairs and maintenance and generally avoided a lot of the hassle of buying.
The new wave of DaaS is much the same, except instead of applying to larger devices like copiers it applies to small mobile devices like phones and tablets. Companies create a leasing contract with a vendor that supplies these items. Once again, it can be a smart move for smaller enterprises that don’t really have the resources to invest in so much hardware all at once.
It Concentrates Device Decisions into the Hands of Experts
With DaaS, IT and security experts at the company are typically the ones making all the decisions (or at least providing the most input) about the type of devices to lease, the models that are needed, the capabilities they need to come with, and what a good plan looks like. You don’t have untrained managers making these top-down decisions alone, and you aren’t leaving it up to the individual whims of each employee. The result is a device strategy that is much easier to work with, and tailored to exactly what the business needs – again, assuming strong IT communication, which is an important first step.
Security Issues are Much Easier to Deal With
For most quality DaaS plans, the vendor offers to provide necessary security management services. That includes any necessary updates or patches. If companies excelled at managing their own updates and immediately patching any vulnerability that is found, this wouldn’t be an issue. But let’s be honest, companies aren’t great at managing device security themselves – the constant series of data attacks around the world is proof enough of that. Handing security over to a vendor that specializes in keeping devices safe, data security is now improved.
There is a Variety of Service Setups
While costs do tend to be monthly, there’s a lot of variety in just what devices and services you can choose from. Many leases allow for some inherent flexibility too, if you suddenly have to scale up or down. Basically, you’ve got options here.
Long-Term Costs Tend to Be Low
Two things: First, the basic, “Buy hardware, fix hardware, pay for apps” costs are difficult to predict but may be higher than just paying the monthly fee for a lease that manages all of that for you (as long as the terms of the lease are favorable). Second, buying hardware directly is a high initial cost, usually a capital expenditure. The lease is a lower operating cost, which looks better on the books and frees up cash for other investments.
New Technology is Far Easier to Access
If you or your employees really need access to the latest technology, DaaS is a great solution to avoid being trapped with the same devices for years while new generations keep coming out. Just update the devices when you renew the lease – problem solved!
Of course, DaaS does come with its own complications regarding employee perspectives and finding the right vendor. For help on deciding whether DaaS is right for your {city} company, contact {company}! Let us know how we can help at {phone} or {email}.
by Felicien | May 25, 2017 | Education
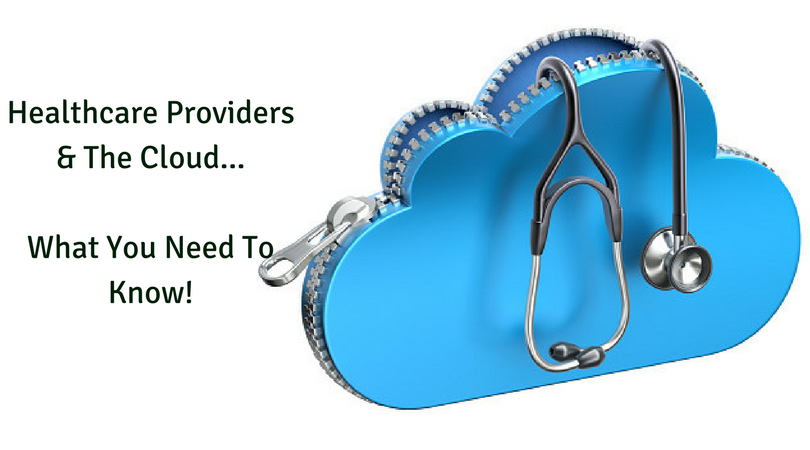
Lack of compliance with HIPAA policies is a major problem among cloud service providers. Take the time to carefully evaluate companies to ensure patient data stays secure.
The healthcare industry was one of the first to recognize the substantial benefits of cloud computing. Cloud services pave the way for better collaboration between doctors and medical facilities, present more available data to treat patients, and permit remote patient care. The important thing to remember is healthcare cloud services have vulnerabilities. Weigh the pros and cons of each service provider to make an informed buying decision.
Features of the Cloud Service Provider
Your software needs will help narrow down your choice of healthcare cloud service providers. For instance, does your organization require an online CRM (customer relationship management) system? Do you need back office functions hosted on the cloud along with clinical data? Does your facility need on-demand access to virtual servers? You may not wish to rely on cloud servers alone and may want a provider who enables a hybrid cloud model. Another requirement you may have is hosting on a private cloud versus a public cloud. A private cloud is developed for large-scale organizations that need customizable features for their healthcare company. Public clouds are shared by some organizations that can use the same types of tools. Public clouds are more cost-effective than private clouds. Scalable service offerings may be considered too if your business needs may change in the future.
Cloud Security and HIPAA Compliancy
Healthcare organizations must follow stringent rules to guarantee the security of patient data. The cloud must align with industry standards and prove that you’re following all compliance regulations. Health cloud service providers need more than basic security features in place. There must be routine security audits done to ensure compliance. Health clouds require a high level of access control. You must be able to tell who is accessing data and when. Standard security measures should be included in your package such as firewall installation, antivirus detection tools, two-factor user authentication, and data encryption. Your selected cloud service provider needs to be completely transparent about who on their end will be able to access data on your network.
Value Reputation Above Price
Although you may wish to reduce overhead costs, choosing a reputable provider is a must. If your provider puts your organization at risk, the cost to repair your company reputation is unimaginable. Many well-known vendors like Microsoft have the resources to help you stay HIPAA compliant by securing data at all endpoints. The organization you choose should let you know the location of their data centers and the type of security in place at the centers. The provider should also talk to you about what kind of backup and data recovery systems are in place.
Good customer support is essential when choosing a health cloud service provider. Your company will likely need support available 24/7 and 365 days a year. The provider should give you an average response time for customer tickets. You want to avoid any service providers who have a reputation for disappearing once you’re set up with their software.
With the right security and features in place, a health cloud can streamline operations within your facility and save your business time and precious resources.

by Felicien | May 25, 2017 | Education
Cloud computing makes big news in the races – and gives us a chance to talk about the benefits of data solutions!
There’s an old saying we just made up that says, “When a trend finally wins a horse race, you know it’s here for the long haul.” We’re specifically talking about the big news that, after a break that involved skipping the Kentucky Derby, the racehorse by the name of Cloud Computing racked up a big in the Preakness race. Maybe not so exciting to those who don’t follow the races, but hey, 1) there’s a racehorse named after a data solution, and that’s pretty fun, plus 2) this gives us an excuse to talk about the advantages of cloud computing to businesses that are still considering adopting cloud solutions.
Scalability
One advantage that smaller businesses sometimes miss when reviewing the benefits of cloud computing is the innate scalability. It may not seem like much in your current business model, but when the time comes to expand, open new branches, increase your customer base, or fulfill a greater number of orders, cloud computing makes growth far easier than it used to be. By pushing customer, order and inventory data into the cloud, it becomes effortless to upgrade many of your business functions to deal with suddenly larger (or, in some cases, suddenly smaller) numbers. Without cloud computing, the process requires replacing hardware and generally spending far more time and resources on meeting new demand.
Automated Data Entry
Data entry has become revolutionized by a combination of cloud computing and artificial intelligence, allowing software to become much more open-ended and smarter about filling out forms. You’ve probably experienced a little of this when Google, Apple or another brand offers to autofill address and contact forms for you based on information stored in the cloud. Data entry solutions do much the same thing, except they are more complex systems that access a larger variety of information about the company and (within chosen limits) the customers. This reduces human error, reduces the need for data entry positions, and helps the workflow process speed up, making it an easy option for the average company.
Collaboration
A lot of people talk about collaboration in business, but in cloud computing, this has a very direct definition: The ability for multiple people to work on the same document, at the same time, from remote locations. Google Drive, for example, is one of the more common (and freed) collaboration tools used by small businesses and students where teams need to work on the same document together, but are kept from physical meetings by complex schedules. Editing, commenting, and chat features allow people to collaborate on a document in an online setting instead, which again speeds up workflow. Even common doc software like Microsoft Word is beginning to embrace this cloud-fueled collaboration.
Efficient Management
All right, let’s take the above example: If you have everyone working on the same document, how does a manager tell who is responsible for any particular action? Through in-depth tracking, of course, and cloud computing also provides that. Microsoft Teams, for example, allows managers to see at a glance who is teamed up on any particular file and then look closer to find out the precise history of changes to the file, and who made each change. If check-ins or confirmations are required, the cloud can send them to manage systems immediately to save even more time.
Client Connections
All this internal communication is also bolstered by external connections. Cloud storage and cloud data, in general, are much easier to share with clients and customers as needed. This is an excellent way to share large files with prospects and exchange information quickly to answer important questions.
Automatic Updating and Syncing
When a cloud-compatible system needs an update, there’s no reason to mess around with physical discs or data sticks – it can simply download what it needs right off the Internet. The same goes for syncing. Via the cloud, when you update data on a program using one device (say a smartphone), that program will be updated on all devices (your desktop and laptop too) when you log back in. Data backups are handled in a similar way. Basically, all improvements and changes to the system are easier and faster to arrange.
We’ve covered plenty of the general benefits of cloud computing here, but there’s a whole world of more specific advantages for your {city} company, ready to be customized from available services. Learn more about the latest IT services by contacting {company} today! We’re available at {phone} or {email}.

by Felicien | May 24, 2017 | Education
WannaCry has brought huge public organizations to their knees. Find out now how to protect yourself from the debilitating ransomware.
The name WannaCry is ominous enough to make it clear just how bad the latest cyber attack truly is. The cyber attack has been linked to debilitating attacks across the globe and targeting seemingly impenetrable systems. If you haven’t yet heard of WannaCry, you need to find out more now. Otherwise, you may find yourself the target of malicious ransomware and having to pay $300 or more to get your computer back up and running.
What’s WannaCry?
WannaCry is a type of ransomware, which first appeared on May 12, 2017. The malware found its way into thousands of computers worldwide due to a Microsoft vulnerability. Once the malware infects a computer, data is encrypted to prevent user access. The infection is obvious since a screen will pop up demanding money for the return of your data. A deadline is set with the ransom amounts increasing the closer you get to the deadline. If the ransom isn’t paid, the hackers delete your files and your data become unsalvageable.
Why the mass attack?
One of the main reasons for the success of the ransomware is due to the vulnerability on older Windows computers. Despite a March 2017 patch released by Microsoft to provide protection against the vulnerability, not all computers are protected. Microsoft only provides support for Windows Vista computers and later. Those companies who were running Windows XP or earlier wouldn’t have received the patch. Many large firms still run on the outdated operating system. Because of this, estimates from the White House homeland security advisor concluded more than 300,000 computers fell victim to the ransomware. The rate of infection was so startlingly that Microsoft decided to extend the patch update to users with older versions of their operating system.
Who got hit the hardest?
Across the United Kingdom, patient care was severely at risk when WannaCry infected the National Health Service network. There were as many as 40 hospitals and 24 trusts infected with the ransomware. Everything within these healthcare systems was affected from imaging programs to patient charts. Non-emergent patients had their appointments canceled and many physicians and nurses were unable to view patient information on their systems. Since 90 percent of hospitals in the UK run XP or older, the organization was an easy target. Other European businesses hit by the malware included Nissan and Renault. Asia was also hit hard by the attacks due to the large incidence of pirated Microsoft operating systems within the country. Utility companies in Asia reported outages and large Japanese manufacturers like Hitachi were also affected by WannaCry.
WannaCry Protection Tips
Cyber security firms have been proactive in dealing with WannaCry and the attack is largely mitigated. Microsoft has urged PC owners to turn on the auto-updating setting. The security update to protect against WannaCry can also be manually downloaded.
When the malware first gained traction, a security firm found a kill switch to stop the attack. However, hackers have updated the program to prevent the kill switch from working. Since the ransomware is so effective, it is believed over $70,000 in BitCoin has been paid to the hackers. Experts advise cleaning your computer and using backups if possible to restore data instead of paying the hackers.
Many WannaCry attacks originated from attachments on phishing emails. Always practice extreme caution when opening any attachments, especially from unverified senders. Also, enable your Windows computer to show file extensions since this helps you spot malicious software. Common extensions to be wary of include .exe, .scr, and .vbs. When in doubt, use caution to save you the headache of handing cash over to cyber criminals.